
By Gregory Coles. Greg is a Senior Research Fellow at The Center and is the author of Single, Gay, Christian and No Longer Strangers.
Last month, I wrote a blog post discussing the findings in a recent study on sexual orientation change. (With apologies for spoiling the surprise: I concluded that the study was methodologically dubious, and that orientation change may not be as forthcoming as the study’s authors and advocates seemed to suggest.)
My post stirred up a small bit of controversy—and so, desiring to do our due diligence, my esteemed colleague Preston Sprinkle and I recently sat down together to review the study’s data and make sure I had handled the numbers responsibly.
As we sat outside a coffee shop in Boise, perusing Preston’s printed copy of the study in question, I realized something strange about Table 3. “Wait,” I said. “That column isn’t supposed to say 2.39. It’s supposed to say 2.12.” I thumbed through the pages, trying to see if I’d confused Table 3 with a different table. But I hadn’t. So I checked the number I’d written in my blog post. Sure enough, 2.12.
Was I somehow misreading the table this entire time, imagining a 2.12 where a 2.39 was supposed to be?
“Where did you get this copy of the study?” I asked Preston. “I’m assuming you didn’t photoshop any of the numbers before you printed it?”
He laughed. “I just downloaded it from the link you sent.”
I pulled out my laptop, opened the PDF I had downloaded four months earlier, and scrolled down to Table 3. There it was, plain as day: 2.12. I hadn’t misread the table. But the table had changed.
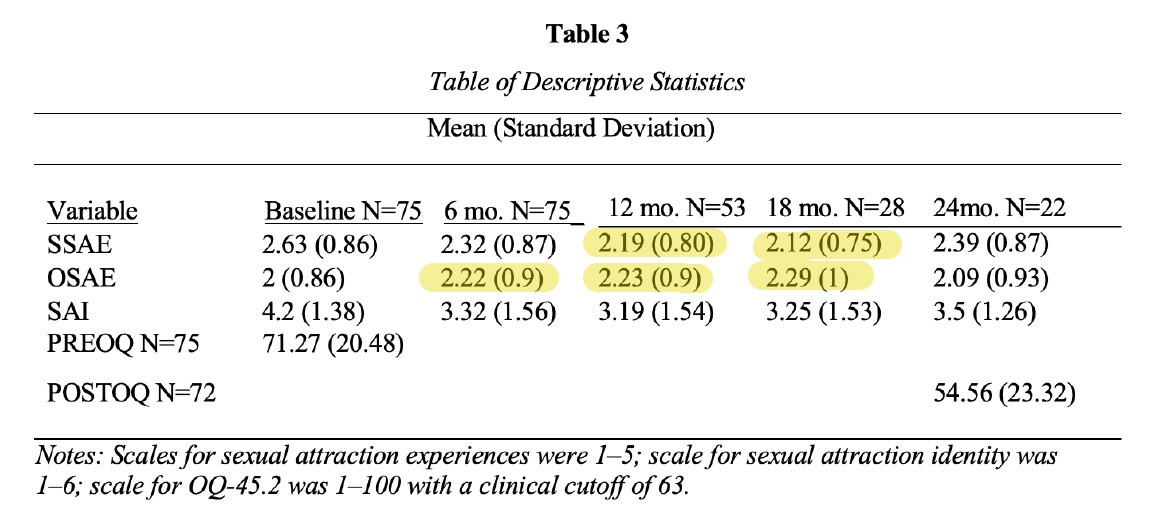
Here’s a screenshot of the original table, which is part of the PDF I downloaded on February 17, 2022, with the relevant numbers highlighted:
And here’s a screenshot of the new table, the one Preston downloaded on June 6, 2022, with the same numbers highlighted:
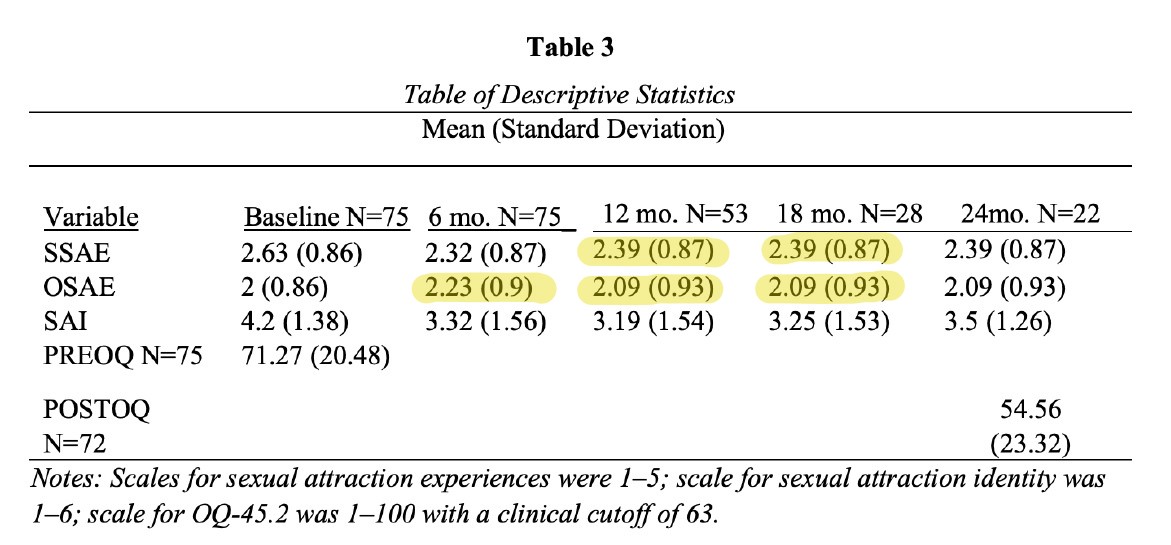
As far as I can tell, there don’t seem to be any major changes between the two PDFs—at least, none I noticed in my reasonably hasty skim. The other five tables appear identical. It’s Table 3 that is different; specifically, the SSAE (“same-sex attraction experiences”) and OSAE (“opposite-sex attraction experiences”) numbers.
I confess I find this curious, given that those are the very same numbers I discussed in my May 11 blog post. A quick excerpt:
Even though the participants’ final rating of their same-sex attraction experiences at the two-year mark (2.39) is lower than their initial report, it is actually higher than the same-sex attraction experiences they reported at the 18-month mark (2.12), the one-year mark (2.19), or even the 6-month mark (2.32). In other words, the final six months of the study seem to show people becoming more gay in their sexual orientation, not less so. They increase from 2.12 back up to 2.39, undoing more than half of their “progress” toward heterosexuality. If the study had continued for another six months, and the same trend had continued, the remaining participants would apparently have been even gayer than they were when they entered therapy in the first place. The same is true for the opposite-sex attraction numbers. These numbers steadily increase until the 18-month mark, then suddenly plummet back almost as low as their starting rate.
If you read what I wrote while looking at the first version of Table 3—the version I was looking at when I wrote it—you can see exactly what I’m talking about. But if you read it while looking at the revised version of Table 3—the version now available to the public—it seems like I’ve simply invented numbers out of thin air.
This is probably just an unintentional editorial error. I’m certainly not suggesting that the changed PDF is part of a conspiracy to discredit my critique (especially since the changed numbers in the 12-month and 18-month columns are now identical to the 24-month column, which looks much more like a sloppy copy-and-paste job than the work of a criminal mastermind).
Even so, I find it intriguing that, sometime between February 17 and June 6, a few of the numbers in this study became as fluid as the sexual orientation change they purportedly depict.